Claude Code has a status line at the bottom of the terminal that shows you
the current model and context usage. It’s useful, but it doesn’t show you
where you are in the filesystem or what git branch you’re on. I already
have Starship configured with all that information
for my shell prompt, so I figured: why not reuse it?
Claude Code lets you set a custom status line command in
~/.claude/settings.json. The command receives a JSON blob on stdin with
the model name, working directory, and context window usage, and whatever
you print to stdout becomes the status line.
The trick is getting starship to output something Claude Code can actually
render. Starship detects which shell it’s running in and wraps ANSI color
codes with shell-specific escape sequences - %{...%} for zsh, \[...\]
for bash. Claude Code isn’t a shell, so those sequences show up as
literal garbage:
[Opus 4.6] | ctx:18% | %{%}~/p/dot-files%{%} on %{%} %{%}main%{%} %{%}❯%{%}
The fix: set STARSHIP_SHELL=plain. There’s no actual “plain” shell type
in starship’s code (I checked - it has bash, fish, zsh, etc.), but
unrecognized values fall through to an “unknown” handler that outputs raw
ANSI codes without any shell wrapping.
I also didn’t want the ❯ prompt character in a status line, so I point
starship at a separate config that disables the character and
line_break modules:
Drop the script and claude-starship.toml in your dotfiles, then run
claude-statusline.sh install. It uses jq to merge the statusLine
config into your existing ~/.claude/settings.json without clobbering
anything else.
Now my status line shows the model, context usage, current directory, and
git branch - all rendered by my existing starship config. And because
it’s in my private dotfiles repo, install works on any machine.
I’ve been using Claude Code to build many wondrous (but often half working)
things. Part of that is getting it to test on it’s own in a web browser.
The official Chrome DevTools
MCP kept freezing up
while I was using it with a Meta Quest 3, and when it did work, asking for
console logs would return massive amounts of data that filled my context
(are there more dreaded words than “Compacting Conversation…”?).
Chrome DevTools Protocol (CDP) is Chrome’s way of letting external programs
control the browser - taking screenshots, evaluating JavaScript, monitoring
network traffic. Most CDP tools are libraries meant to be imported into
code, but Claude Code needs a CLI.
I built @myerscarpenter/cdp-cli. It outputs NDJSON (newline-delimited
JSON) - one complete JSON object per line, making it grep-compatible and
easy to parse.
The key feature is the console command. By default it outputs bare JSON
strings and shows only the last 10 messages:
This saves tokens. When you need more detail, flags like --verbose,
--tail 50, or --all give you control over how much data comes back.
When truncated, it warns on stderr so Claude Code knows there’s more
available.
I’m also liking using cli’s over mcp’s as you can see exactly what it’s
doing.
Chrome needs to be running with remote debugging enabled:
I saw this
post
with a demo link in it, and wondered: can I use my quest 3 with virtual
desktop to try this WebGPU + WebXR demo out?
WebGPU is the modern way to tap into your computer’s graphics card (GPU)
directly from a web browser. Before WebGPU, browsers used an
older technology called WebGL, which worked but was kind of showing its age.
WebGPU is faster, more efficient, and gives developers way more control over
how they use the GPU.
WebXR you experience virtual reality (VR) and augmented reality (AR)
directly through your web browser. The “XR” stands for “extended reality,”
which is just a catch-all term for both VR (where you’re fully immersed in a
virtual world) and AR (where digital stuff gets overlaid on the real world).
So if you’ve got a VR headset like a Meta Quest, WebXR lets websites tap
into that hardware and create immersive experiences.
The Chrome team is working towards allowing you to use WebGPU to power
WebXR, but it’s not in the navtive Quest Browser.
I couldn’t get a good answer about if it would work, and if not, why not
from Claude Research. The answer is it does work.
Buy Virtual Desktop
In Chrome go to chrome://flags and turn on any flags to do with WebGPU.
Put on your Quest 3 and connect to your desktop via Virtual Desktop
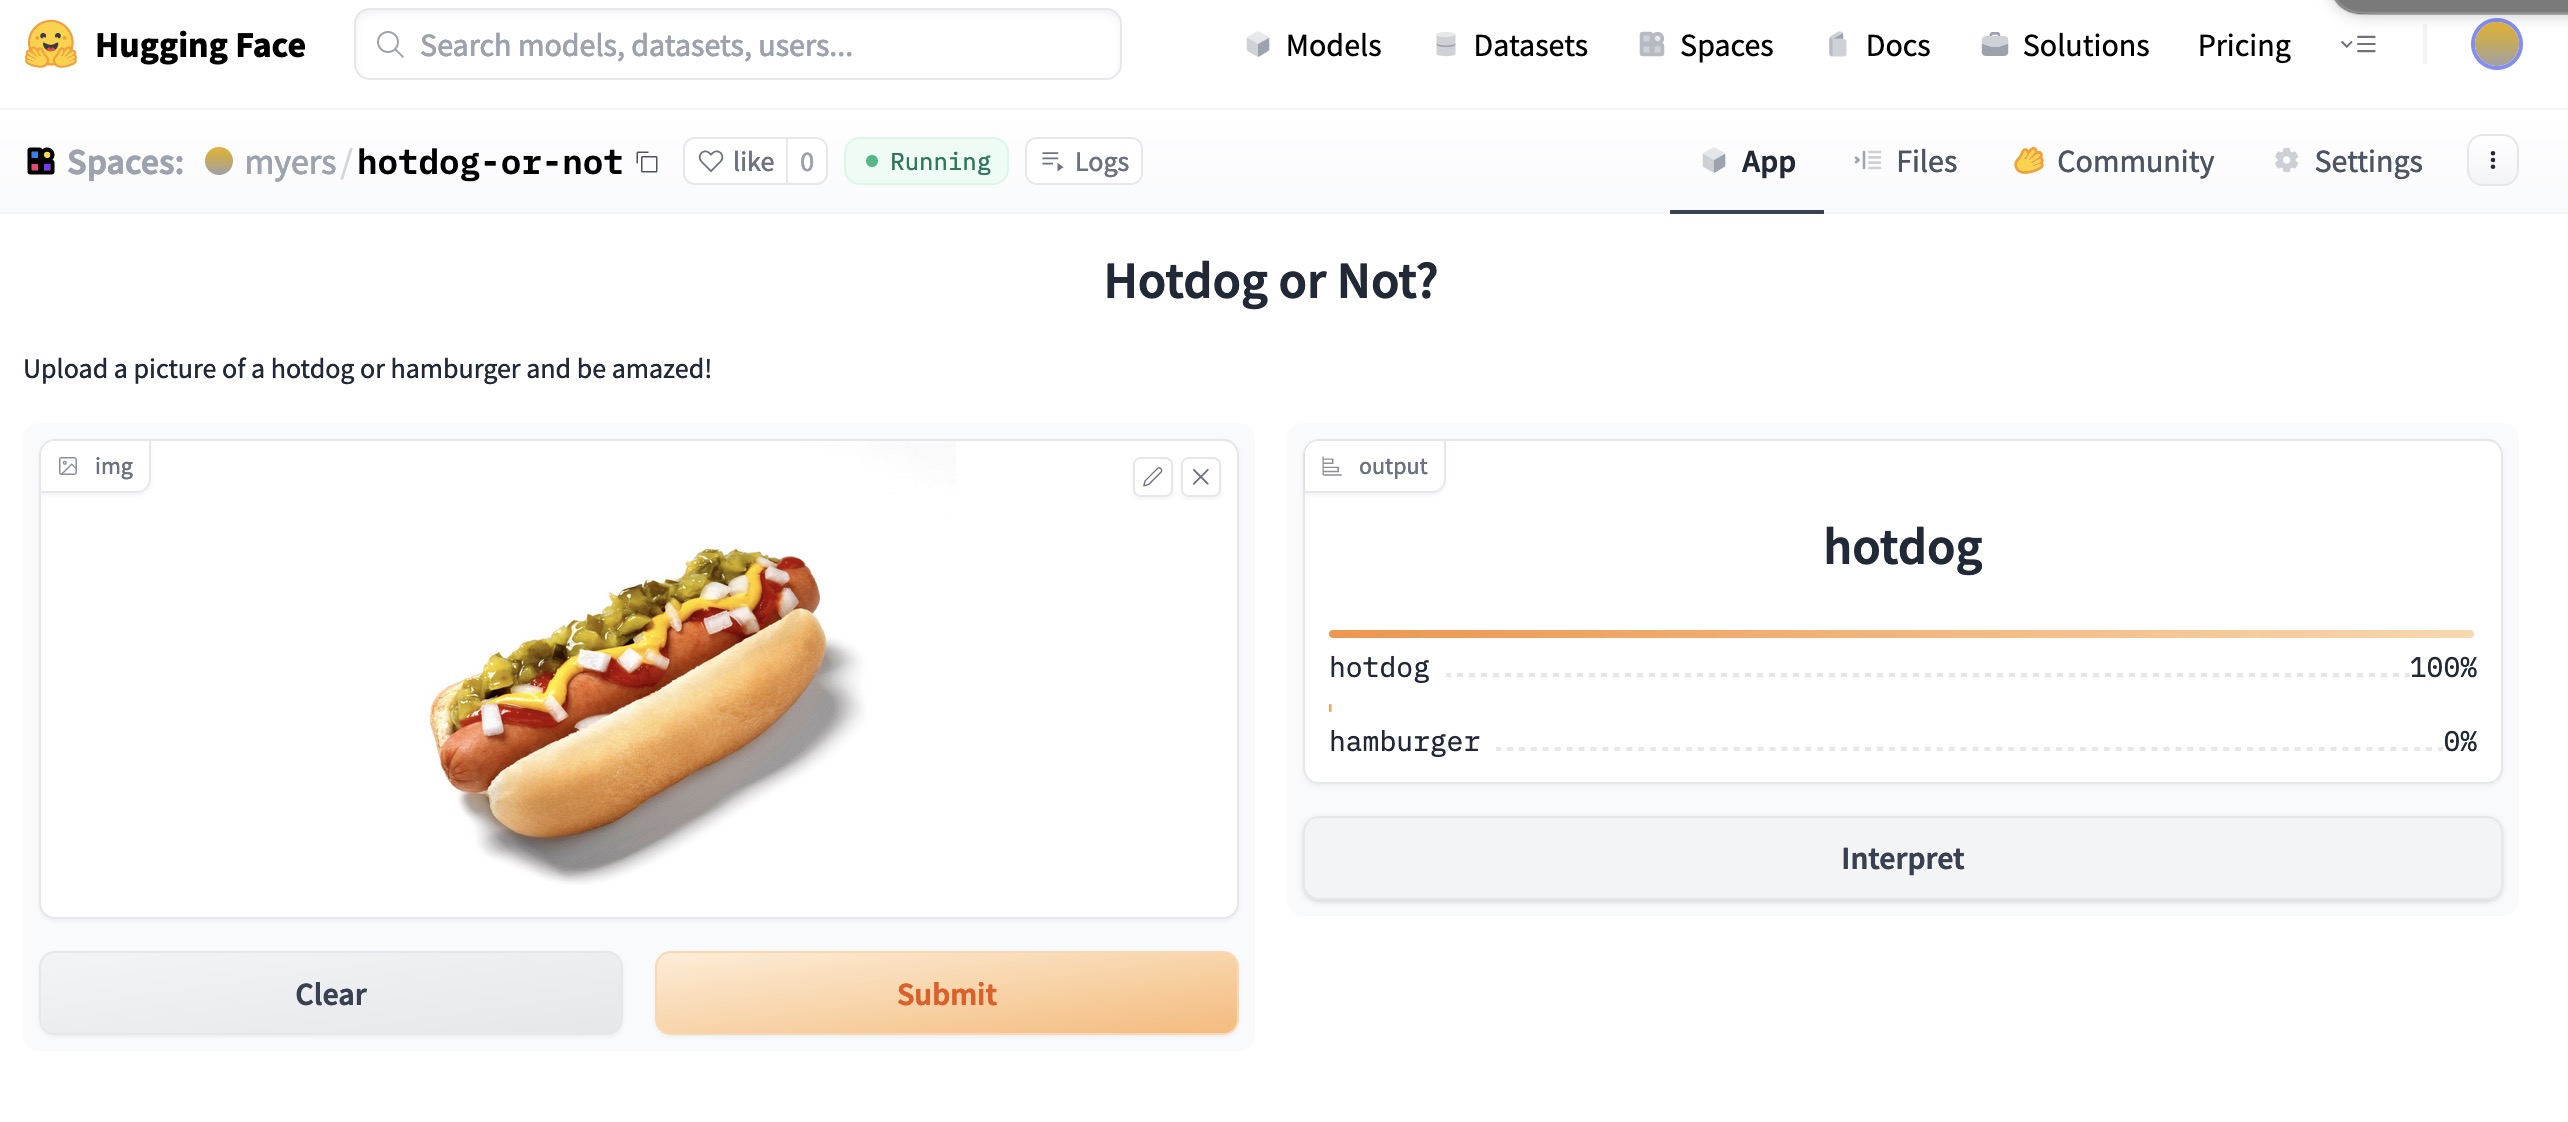
Hugging Face 🤗 is darn slick. Your project is built into a docker image and then launched as needed. Github could learn a thing or two about showing status. There was some errors due to the fastai API changing to no longer needing you to wrap an image that you want to predict in a PILImage and another problem with adding example images, that I solved by just removing them.
The biggest change since I last took a course on Machine Learning is one of the key points of this course: the use of foundational models that you fine tune to get great results. In this lesson’s video we fine tune an image classifier to see if a picture has a bird in it.
While building my own model I attempted to get the classifier fine tuned to look at comic book covers and tell me what publisher it was from. I thought with the publishers mark on 100 issues from Marvel, DC, Dark Horse, and Image the classifier would be able to tell. The best I was able to do was about 30% error rate, a far cry from the 0% in the example models. I tried a few different ideas of how to improve:
train with larger images. The notebook used in the video makes the training go faster by reducing the size of the image. As I write this I wonder if it is even possible to use larger images in a model that might have been trained on a fixed size.
create a smaller image by getting the 4 corners of the cover into one image.
clean the data so that all the covers in the dataset had a publisher mark on them.
sample cover from X-Men Red #2 with only the corners
Nothing moved the needle. I’m hoping something I learn later in the course will give me the insight I need to do better.
I took a second attempt with a simpler project. Of course I remembered that Silicon Valley episode with the hot dog detector, and make a hot dog vs hamburger classifier. It works great. The next lesson covers getting a model like that into production, so hang tight.
 001-000.jpg)